Overview
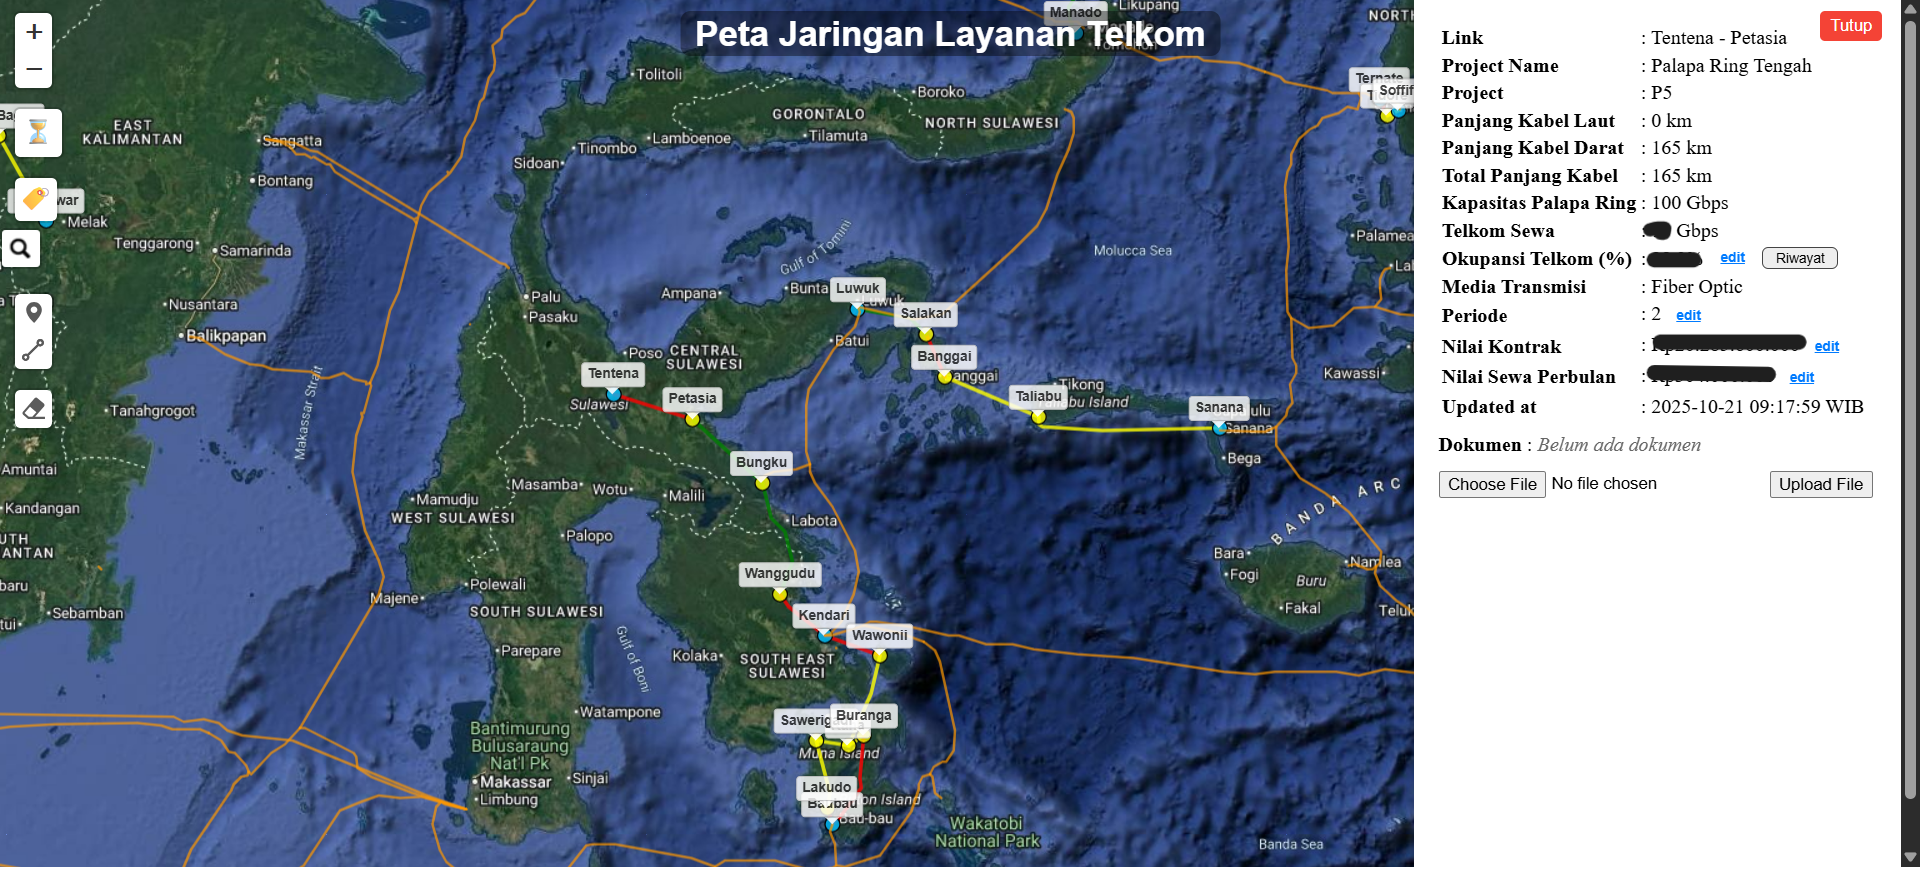
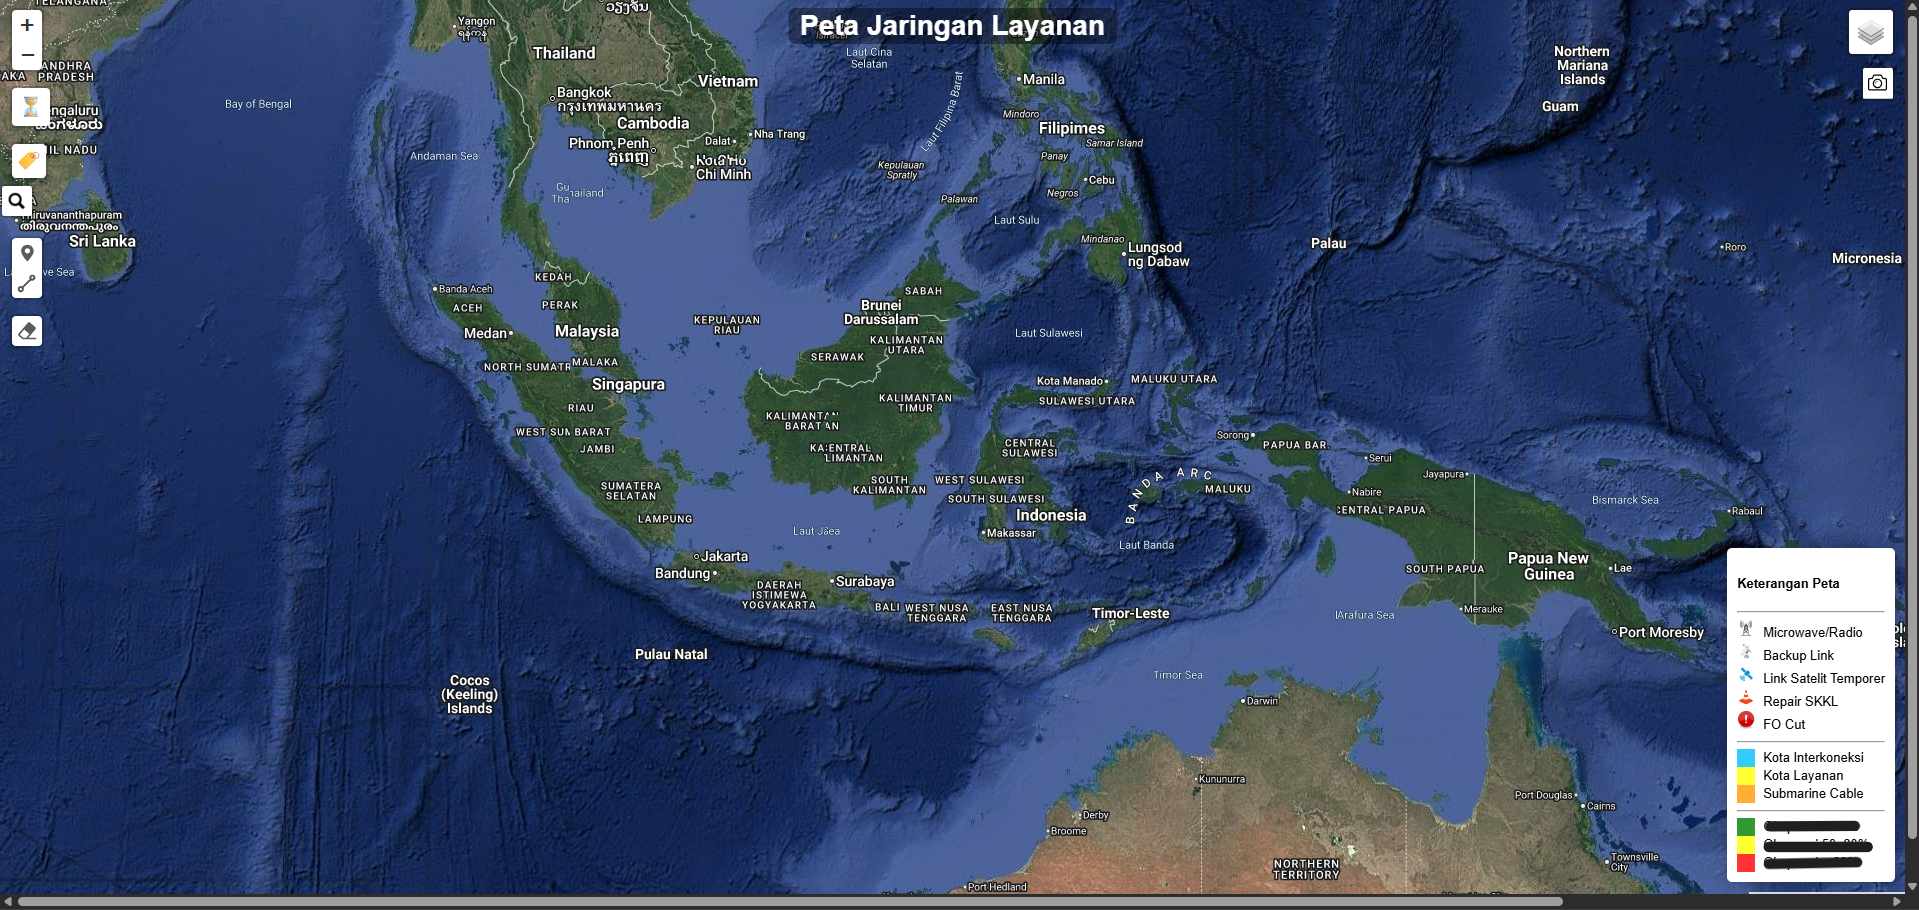
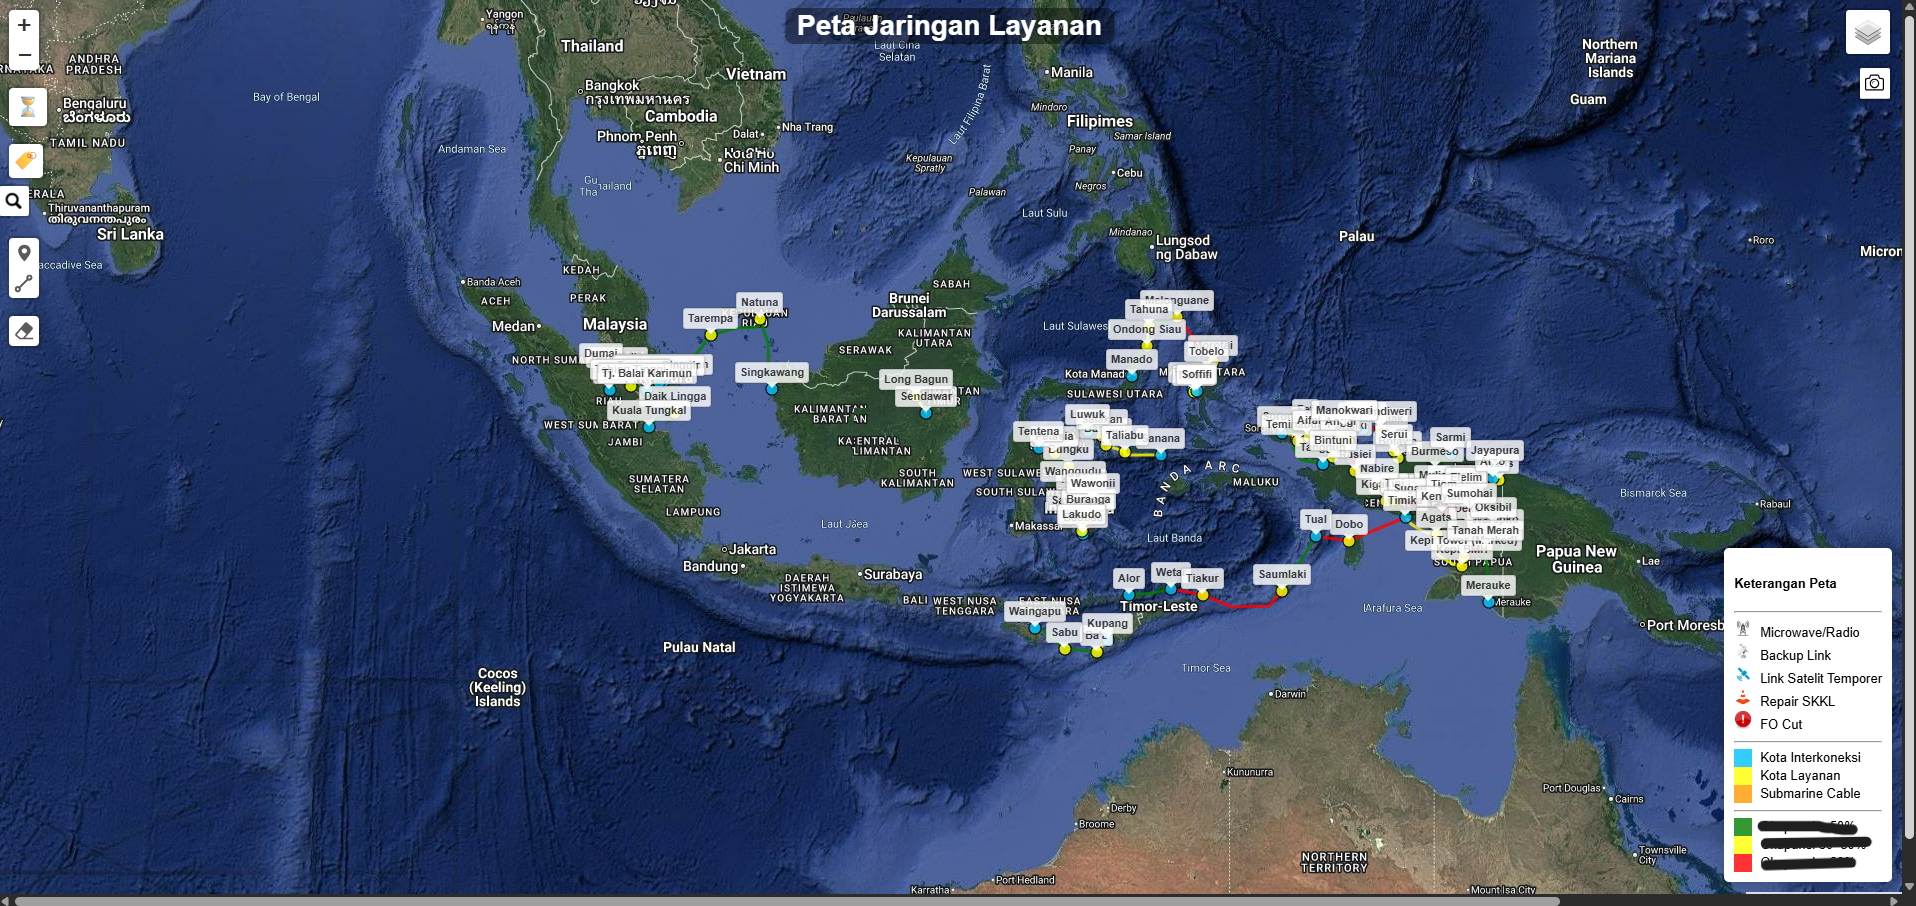
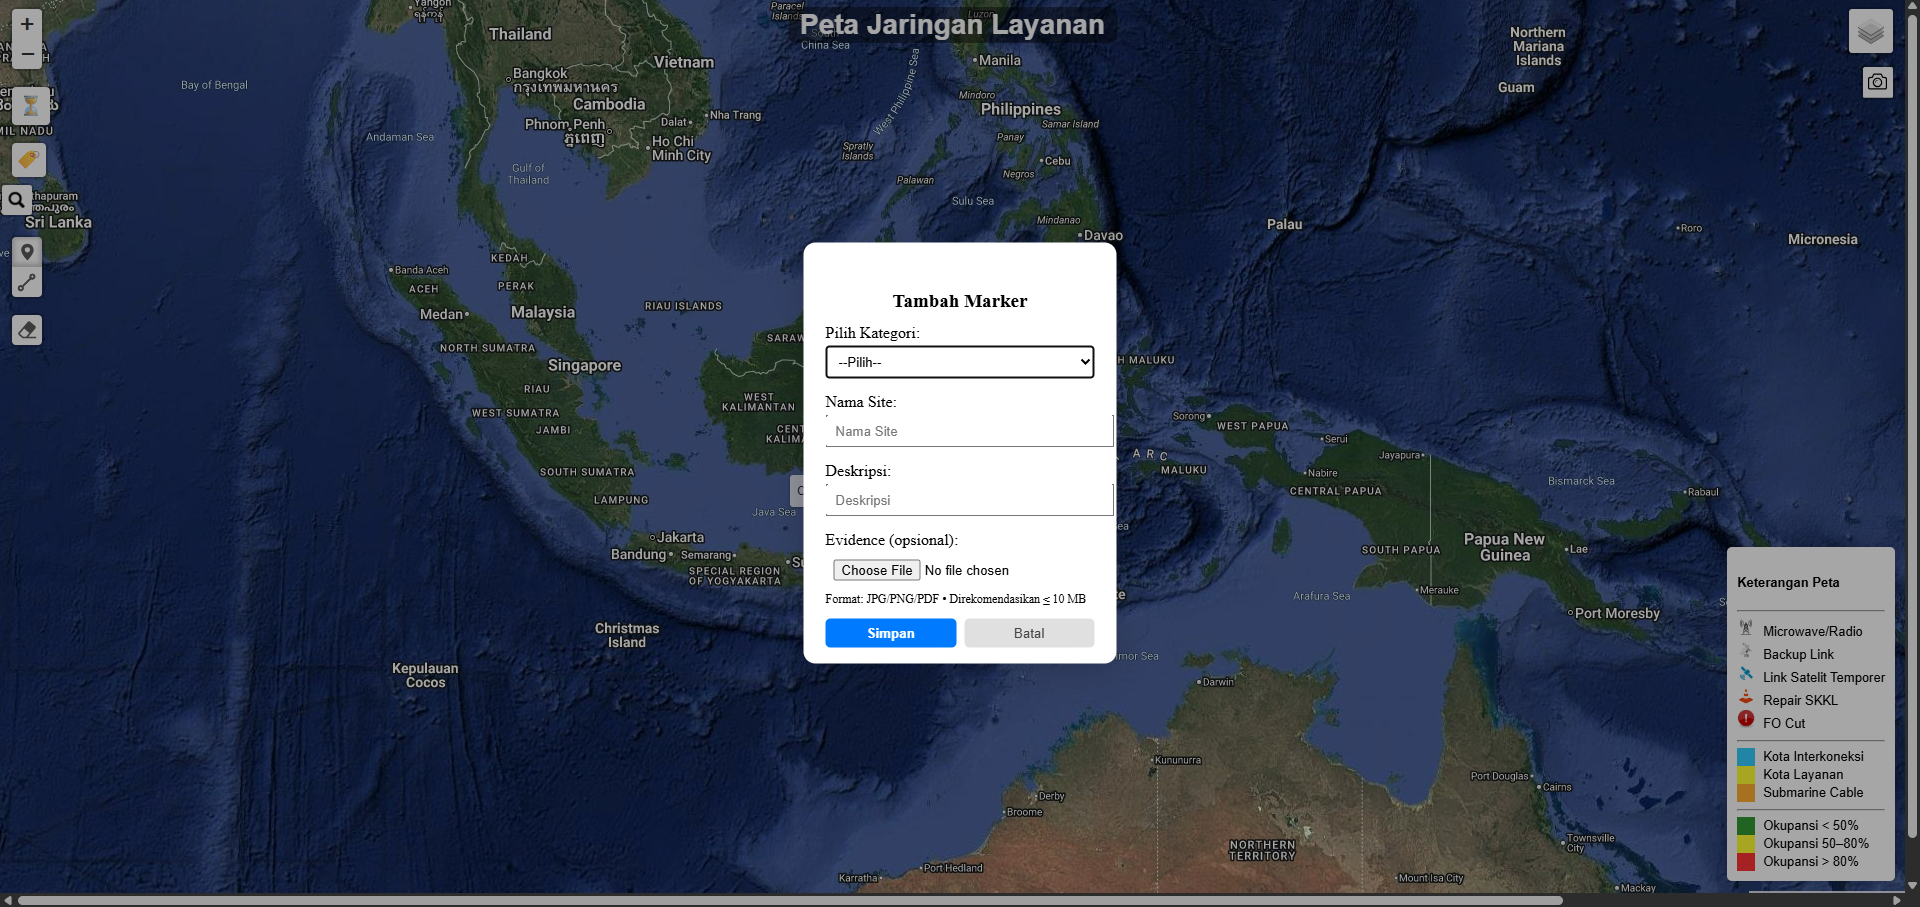
During my internship at Telkom Indonesia, I was assigned to develop this interactive web-map dashboard to enable my unit to monitor numerous services in a single dashboard. This dashboard consolidates service status, locations, performance, problems, and other relevant information, significantly improving operational efficiency.
GitHub Link: https://github.com/raihanr7/paringproject.git
Note: Some services and features are not shown in the documentation and GitHub due to Non-Disclosure Agreement (NDA) restrictions.
Development Process
- Planning & Data Preparation - Analyzed unit needs, gathered service data (coordinates, descriptions, status), and consulted with experts for technical guidance and best practices
- Database Design & Migration - Cleaned and processed data in PostgreSQL, then migrated to Supabase for cloud-based storage and real-time access
- Backend Development - Built and using Python Flask API to handle data queries, service status updates, and real-time monitoring
- Frontend & Map Integration - Developed interactive web interface with map visualization using HTML, CSS, and JavaScript for geospatial data display
- Testing & Deployment - Conducted testing, trial and error, gathered unit feedback, and deployed the dashboard for production use
Documentation
Tools used
Development Tools
Python
PostgreSQL
 Supabase
HTML/CSS/JS
Supabase
HTML/CSS/JS
 VS Code
 ChatGPT
 QGIS
QGIS
Supabase
HTML/CSS/JS
QGIS